

Microsoft provides plenty of documentation on Diagnostic Data Viewer that can be obtained from the Windows Store. This blog post aims to share what the Diagnostic Data Viewer application looks like to the end user and how it can be manipulated by a forensic examiner.
Diagnostic Data Viewer – Diagnostic Data
Users can view, search and conduct basic filtering on the contents of EventTranscript.db in real time within the Diagnostic Data Viewer tool (Figure 1).
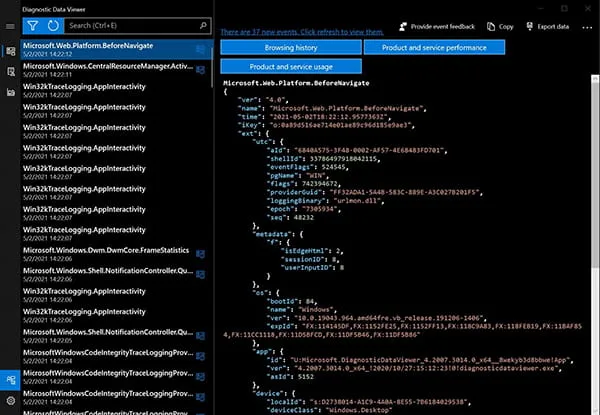
Figure 1: Diagnostic Data Viewer
Below is a breakdown of the Diagnostic Data Viewer graphical user interface (GUI) (Figure 2).
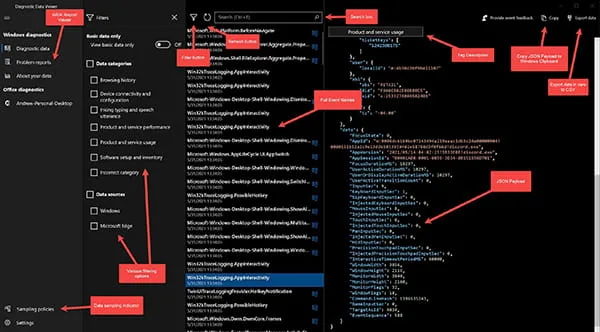
Figure 2: Diagnostic Data Viewer – Marked Up
New events are recorded continuously as the tool is being used. Users can also refresh the GUI to view and query those new events (Figure 3).
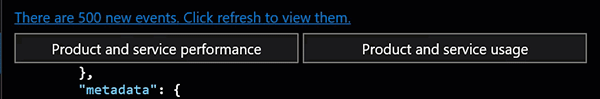
Figure 3: Refreshing Diagnostic Data Viewer by Clicking on New Events Indicator
Users can also filter on the various tag_descriptions mentioned in the Contents of EventTranscript.db blog post as well as the two (2) presently known data sources (Windows and Microsoft Edge) (Figure 4).
Figure 4: Filtering within Diagnostic Data Viewer
The JSON Payload for each event recorded is immediately viewable within the Diagnostic Data Viewer application (Figure 5).
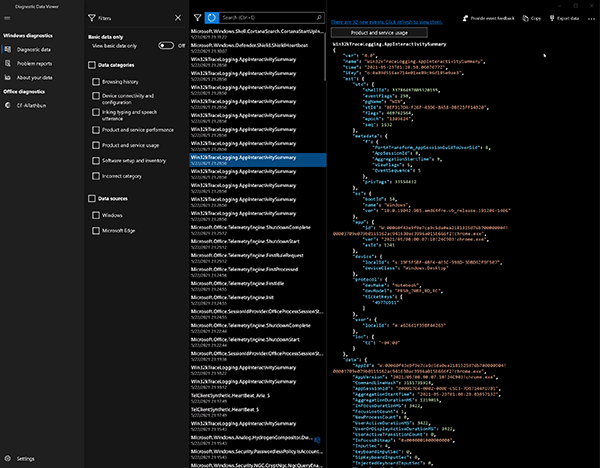
Figure 5: JSON Payload Overview
Data can be exported from EventTranscript.db directly from the Diagnostic Data Viewer application using the Export Data function (Figure 6). The export will produce a CSV file with the three (3) columns: (1) Time Stamp; (2) Full Name (same as Event name); and (3) JSON.
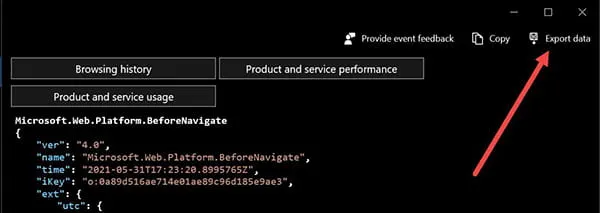
Figure 6: Export Data Function
Diagnostic Data Viewer – Problem Reports
Section 2 of the Diagnostic Data Viewer application covers Problem Reports. Within Problem Reports, crash reports associated with Windows Error Reporting are viewable, which are derived from .WER files that are stored in C:\ProgramData\Microsoft\Windows\WER\ (Figure 7).
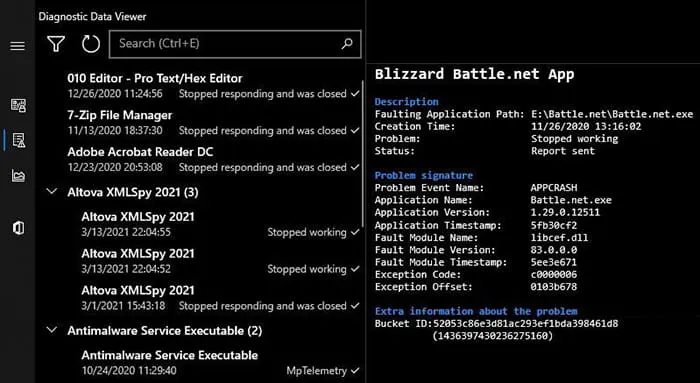
Figure 7: Problem Reports
Please note, KAPE can pull these files using the Windows Error Reporting (WER.tkape) Target. Also, see the blog post regarding Parsing EventTranscript.db with KAPE and SQLECmd.
Diagnostic Data Viewer – About Your Data
Section 3 of the Diagnostic Data Viewer application is called About Your Data. This provides an informative dashboard view of the data being stored within EventTranscript.db.
Selecting the Export data option here will produce a CSV file with the text values in Column A and the number values in Column B, as demonstrated in Figure 8.
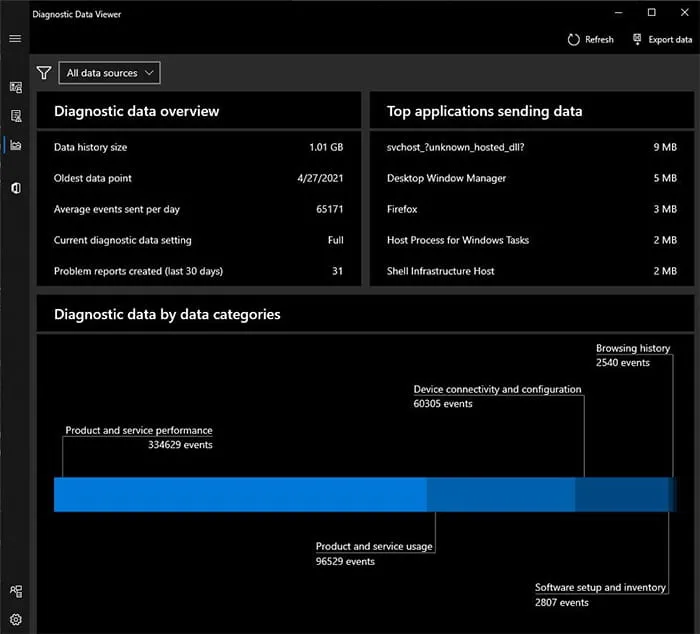
Figure 8: Export Data Option Values
Lastly, the Settings menu can be launched by the gearwheel at the bottom left of the Diagnostic Data Viewer application (Figure 9). Within the Settings menu, the amount of data that EventTranscript.db can store can be set to these increments: 128MB, 256MB, 512MB, 1GB, 2GB, 5GB or 10GB of data. Additionally, the user can specify EventTranscript.db to store either one, seven, 14, 30, 90 or 180 day(s) of data. This database will start rolling over data once either the time or size threshold is met, whichever comes first.
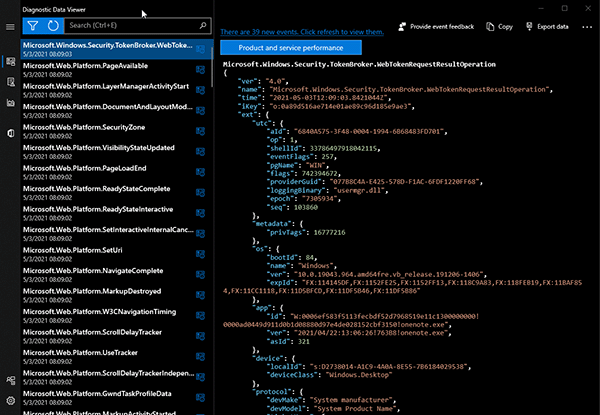
Figure 9: Overview of Diagnostic Data Viewer Settings Menu
Office Diagnostic Data
While not on by default, Office Diagnostic Data is located below About Your Data once it is enabled within the Diagnostic Data View application (Figure 10).
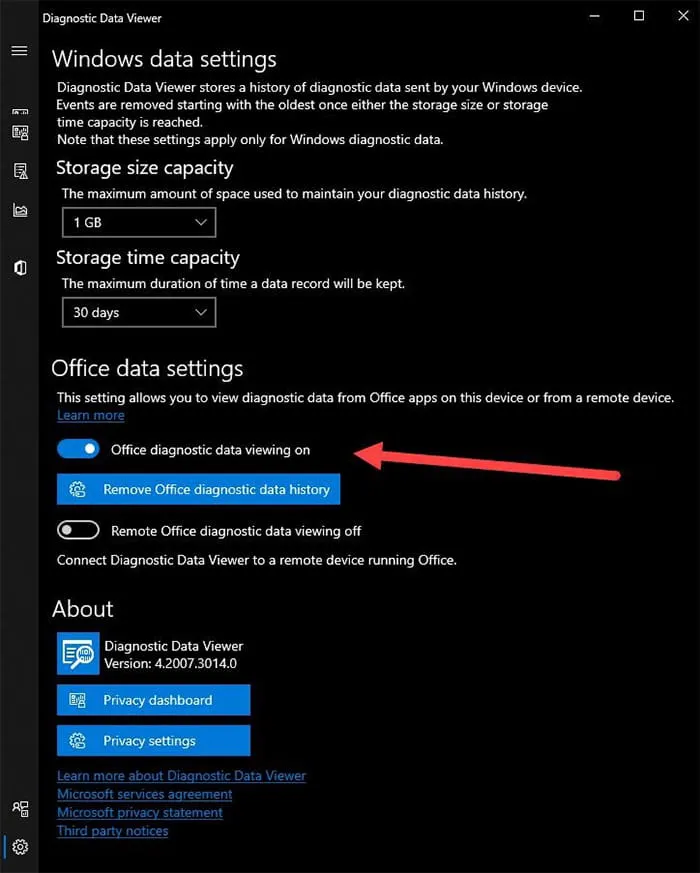
Figure 10: Office Diagnostic Data Setting
In addition to turning this on, the end user must go within an Office application, i.e., Word or Excel, and navigate to the following menu options:
1. Go to File > Options > Trust Center > Trust Center Settings > Privacy Options.
2. Select the Diagnostic Data Viewer button.
3. Choose Enable data viewing on the endpoint and select OK.
Microsoft also provides documentation that highlights a similar process using an Office application to adjust account settings. Here is what this looks like from the OneNote 2016 application (Figure 11)
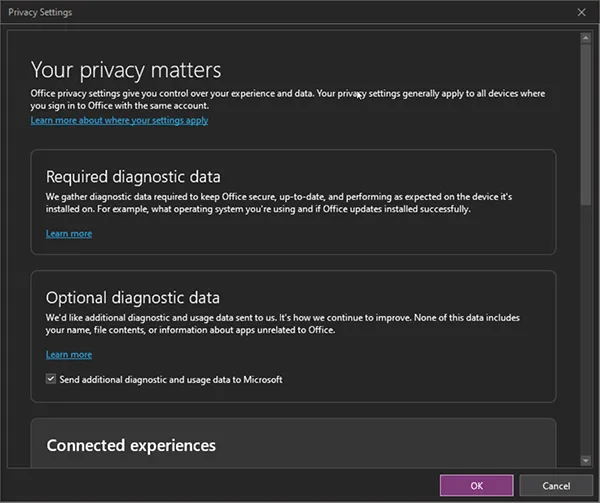
Figure 11: Privacy Settings within OneNote 2016 relating to Diagnostics and Telemetry
Data Sampling
When the end user chooses to provide optional diagnostic data and telemetry to Microsoft, it is up to Microsoft to choose the user’s system for that optional diagnostic data logging. Once chosen, the number/details of events viewable within Diagnostic Data Viewer increases greatly. To learn if data sampling is enabled on an endpoint, check if filtering within the Diagnostic Data section states View basic data only or View required data only (Figure 12).
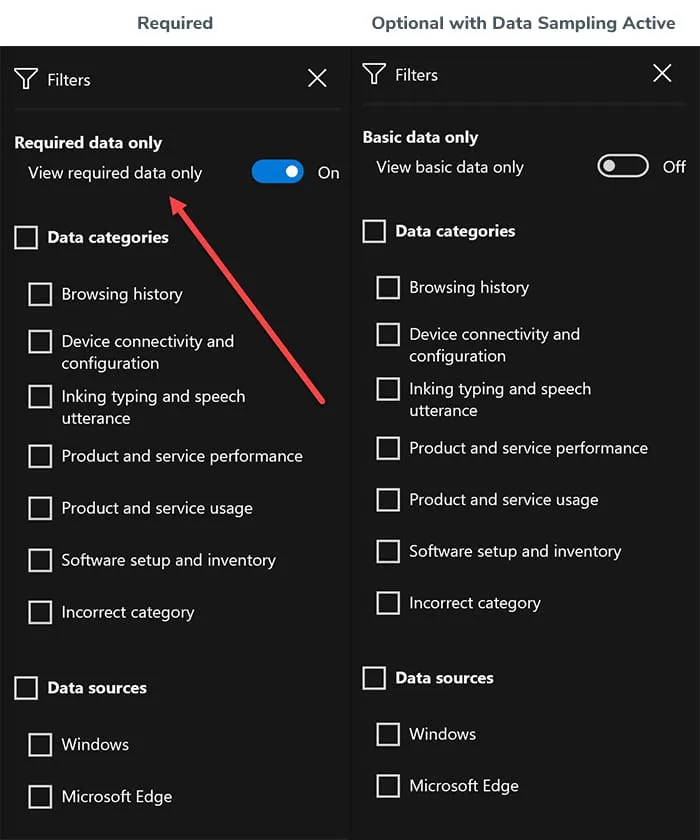
Figure 12 – Diagnostic Data Optional Settings
