This edition of the Cost Trend Update Bulletin shows the national averages for the U.S. from January 2017 to March 2022 and demonstrates how construction and equipment cost indices have performed over the past five years.
Construction Cost Indices
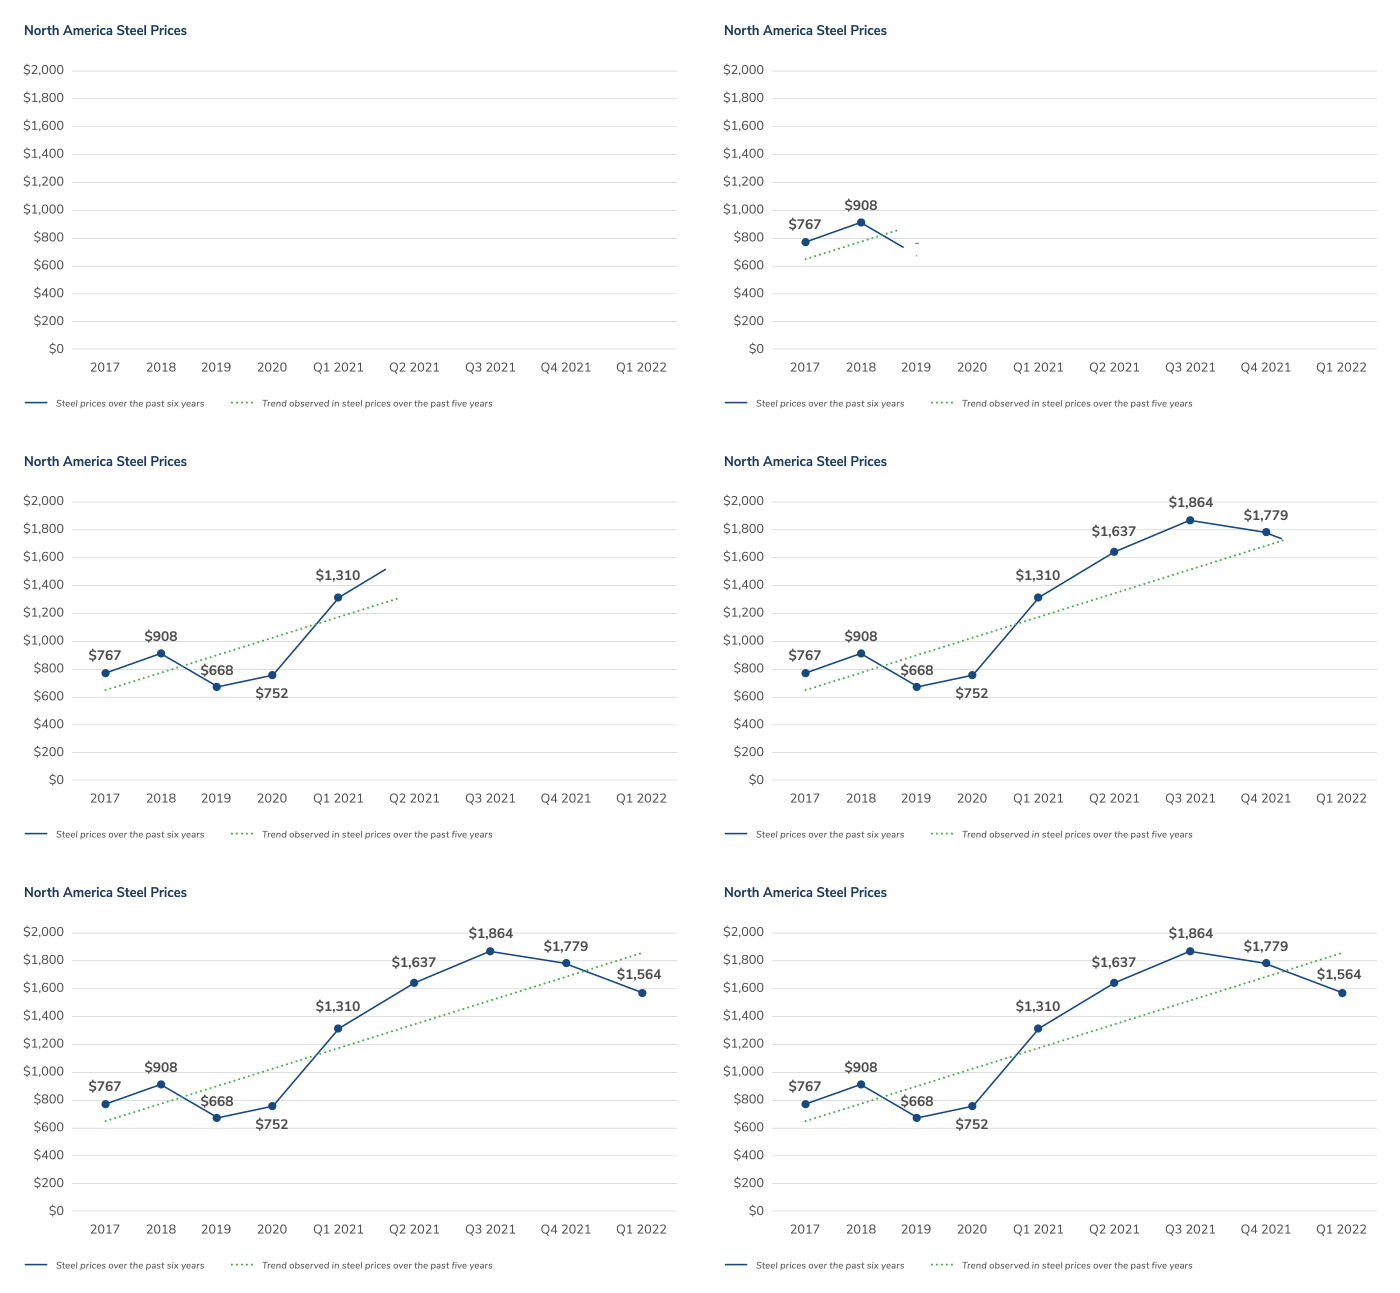
In 2021, we saw one of the largest increases in construction costs on record—and based on the data published in Q1 2022, that trend does not appear to be slowing down. Overall inflation continues to permeate through the economy, whether in the transportation/shipping industry and the rising fuel costs, manufacturing and the supply chain concerns or the other numerous factors impacting the economy. Steel prices, a leading indicator of construction indices, are displayed graphically below and indicate a peak in Q3 2021 before coming back down in Q4 2021 and continuing to fall in Q1 2022.1

With regards to labor, wages continue to rise rather significantly, and more experienced individuals are entering the workforce. However, there is a limit to the availability of qualified individuals. The average wages for those working in construction have increased at an annual rate of 3.6% over the last 12-month period.2
|
Indices |
2017 |
2018 |
2019 |
2020 |
2021 |
2022 (Q1)* |
|
ENR – Building Cost Index3 |
3.30% |
3.20% |
1.74% |
3.96% |
13.1% |
4.33% |
|
FM Global – US Industrial Buildings Average4 |
1.20% |
5.20% |
1.73% |
1.42% |
18.49% |
NA |
|
RS Means – 30-City Average5 |
4.00% |
5.50% |
2.05% |
1.71% |
16.2% |
4.51% |
|
Marshall & Swift, US Average6 |
2.7 to 3.7% |
3.2 to 6.0% |
0.0 to 1.3% |
3.0 to 6.1% |
13.6% to 19.9% |
3.0% to 5.1% |
Note: The range of change shown by Marshall & Swift represents different classes of construction.
*2022 (Q1) represents an increase from the beginning to end of Q1 2022 only.
Equipment Cost Indices
It was not surprising that all three sources for equipment cost indices saw significant, almost unprecedented increases in 2021. Just as the construction cost indices inflation, energy costs and supply chain issues are having a major impact too.
It is important to take care when selecting an index to track the rate of cost change for your company’s capital equipment. All three indices in the table below track average capital equipment cost change percentages and indicate the differences that have occurred over the past five years. Developers—as well as insurance brokers, underwriters and valuation consultants—can all recommend appropriate indices or your facilities. It is a best practice to select one that represents your capital equipment as closely as possible; there are significant differences between the average indices shown here and specific industrial-sector indices.
|
Indices |
2017 |
2018 |
2019 |
2020 |
2021 |
2022 (Q1)* |
|
Marshall & Swift/Boeckh - Industrial Equipment Avg.6 |
2.60% |
4.80% |
0.77% |
2.54% |
19.6% |
3.51% |
|
US Bureau of Labor Statistics - Producer Price Index for Finished Goods, Capital Equipment7 |
0.90% |
2.70% |
1.13% |
0.95% |
7.25% |
1.9% |
|
FM Global - Industrial Equipment Composite4 |
1.20% |
2.80% |
1.93% |
1.52% |
6.72% |
4.38% |
Always remember that cost indices are just average indicators of change; they are not absolutes, and there is no average building or average assemblage of equipment. After five to seven years, you should establish a new replacement cost basis by using a qualified valuation consultant.
Sources
1.MEPS (International), Ltd. All carbon steel products composite price and indice
2.U.S. Bureau of Labor Statistics, Employment Cost Indice, Wages and Salaries for Private industry workers in construction, 12-month percent change
3.Engineering News-Record, Monthly Construction Economics Report
4.FM Global, Industrial Cost Trends
5.RSMeans, Construction Cost Indices, 30-City Average
6.Marshall & Swift/Boeckh, Marshall Valuation Service, Quarterly Cost Indice
7.U.S. Bureau of Labor Statistics, Producer Price Indice for Finished Goods - Capital Equipment
Stay Ahead with Kroll
Fixed Asset Advisory Services
Kroll provides clients the transparency they need by identifying, managing, and valuing their fixed assets.
Fixed Asset Management
Kroll has established best practices in fixed asset management that are recognized across our profession.
Insurance Valuation Services
Kroll provides commercial and personal property insurance valuation services (for fixed assets like buildings, plant and machinery) to clients worldwide.
Machinery and Equipment Valuation
Kroll offers experience, reliability and transparency in the valuation of machinery and equipment for virtually every industry.
Valuation Services
When companies require an objective and independent assessment of value, they look to Kroll.