The CyberClarity360 team continue to find ways to improve their ground breaking third party cyber risk assessment platform. One of the major areas of focus in Q4 of 2019 was enhanced reporting. With these new developments, Chief Information Security Officers and Chief Third-Party Risk Managers will be able to better understand changes to their third party cyber risk ecosystem. To see these changes for yourself, please reach out to [email protected] to learn more or get a demo and see how CyberClarity360 can help you reduce your third party cyber risk.
What’s New
Enhanced Reporting Experience
Reports are now accessible via a new card interface. Each card features a visual indicator of the data represented in the underlying report and allows you to quickly identify which reporting module you’re looking for. You can find this in the portal’s left navigation menu under Reporting.
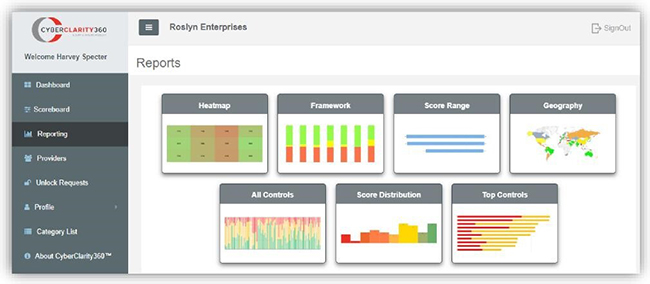
New Reporting Modules: Score Distribution, All Controls, Top Controls
We’re excited to bring your data to life and help tell your risk story. These new reporting modules empower you to identify portfolio risk through new rich, interactive reporting experiences. These reports are now available in your CyberClarity360TM Corporate Portal, in addition to existing reports around category performance, overall framework performance and geography. Details on each of the three new modules is below.
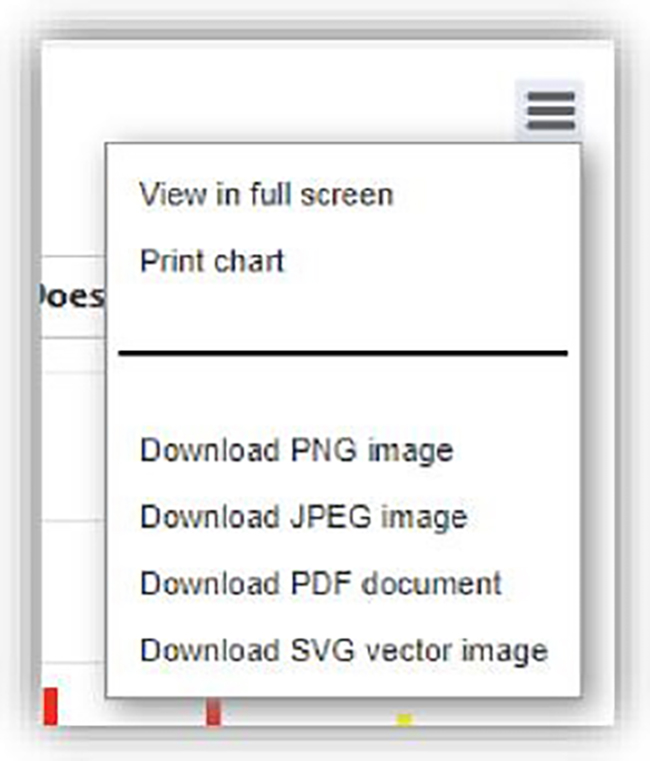
Export Report Feature
Each report features the ability to be viewed in full screen, printed or downloaded as a PNG, JPEG, PDF or SVG.
Full screen mode is particularly useful for presentations or exploring the data in a highly interactive, real-time modality.
New Reports
Score Distribution
View the overall performance of your providers through customizable score ranges. This report will allow you to quickly parse performance groups (for example, two bins to show those Providers who might need immediate attention, three bins to show low/medium/high performing providers, four bins to examine performance by quartile, etc.).
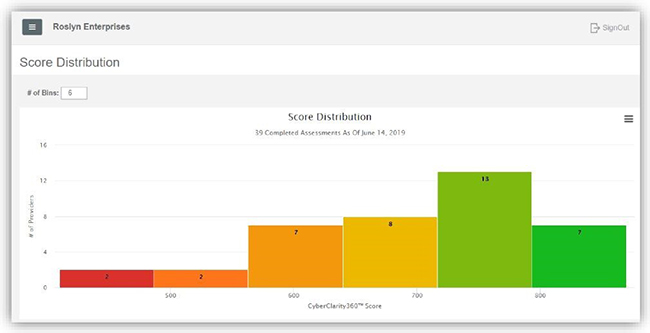
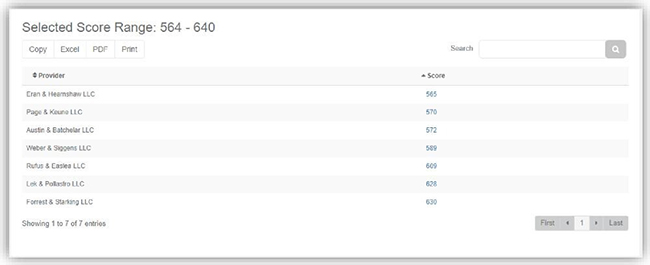
Each Score Distribution bin is interactive, allowing you to click to see which providers make up the group, enabling detailed analysis of an individual provider’s results right from within the reporting module.
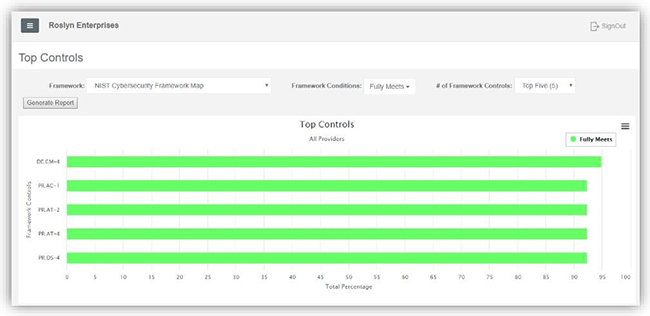
Top Controls
The Top Controls report allows you to see controls that are either most mature or least mature across your provider portfolio.
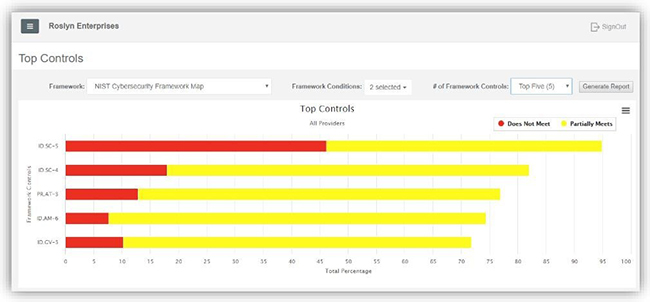
The report also allows you to select from your available control frameworks, choose which framework conditions you would like to report out on, and select the top 3, top 5, top 10 or all controls for your chosen conditions.
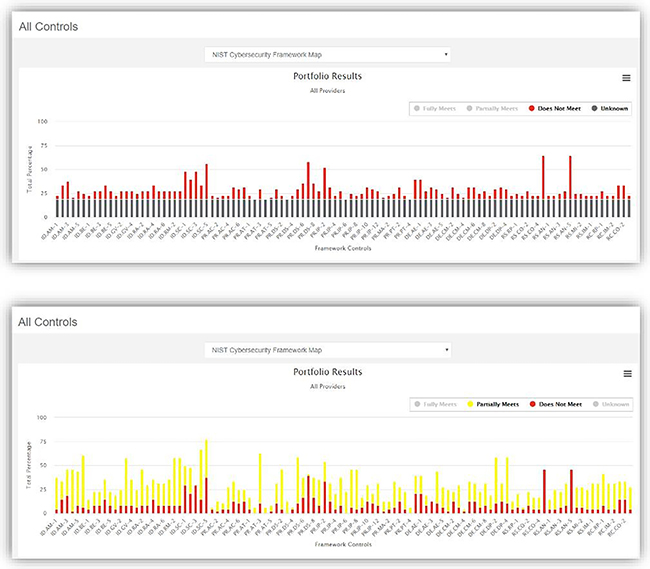
All Controls
The All Controls report gives you performance visibility into all controls in a chosen control framework across your entire provider portfolio, including those providers who have not yet completed their assessments. This is particularly useful to represent the big picture while giving a sense of scope and scale to the amount of controls that are being assessed.
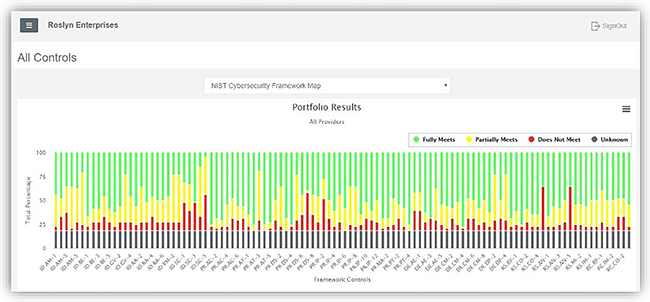
This report is interactive, allowing you to select different conditions to display right from within the report itself.
Stay Ahead with Kroll
Cyber and Data Resilience
Kroll merges elite security and data risk expertise with frontline intelligence from thousands of incident responses and regulatory compliance, financial crime and due diligence engagements to make our clients more cyber- resilient.