
Publication
October 30, 2017
Duff & Phelps U.S. Equity Risk Premium Recommendation Decreased from 5.5% to 5.0%, Effective September 5, 2017
Executive Summary
The Equity Risk Premium (“ERP”) changes over time. Fluctuations in global economic and financial conditions warrant periodic reassessments of the selected ERP and accompanying risk-free rate. Based upon current market conditions, Duff & Phelps is decreasing its U.S. Equity Risk Premium recommendation from 5.5% to 5.0%. The 5.0% ERP guidance is to be used in conjunction with a normalized risk-free rate of 3.5% when developing discount rates as of September 5, 2017 and thereafter, until further guidance is issued. View our additional cost of capital research.
In summary:
- Equity Risk Premium: Decreased from 5.5% to 5.0%
- Risk-Free Rate: Reaffirmed at 3.5% (normalized)
- Base U.S. Cost of Equity Capital: 8.5% (5.0% + 3.5%)
Background
The ERP is a key input used to calculate the cost of capital within the context of the Capital Asset Pricing Model (“CAPM”) and other models. Duff & Phelps regularly reviews fluctuations in global economic and financial market conditions that warrant a periodic reassessment of the ERP.1 Based on current market conditions, we are decreasing the recommended U.S. ERP from 5.5% to 5.0% when developing discount rates as of September 5, 2017 and thereafter, until there is evidence indicating equity risk in financial markets has materially changed and new guidance is issued. Duff & Phelps last changed its U.S. ERP recommendation on January 31, 2016.2 On that date, our recommendation was increased to 5.5% (from 5.0%) in response to evidence in late 2015 and early 2016 that suggested an increased level of risk in financial markets. Later in the year, on November 15, 2016, Duff & Phelps reaffirmed its U.S. ERP recommendation of 5.5%, but lowered the accompanying normalized risk-free rate from 4.0% to 3.5%, supported by academic evidence of declining real interest rates and long-term growth potential for the U.S. economy.3
Towards the end of 2016 – particularly after the surprising win of the U.S. presidential elections by Mr. Trump-and the beginning of 2017, we saw some indications that equity risk in financial markets was declining. However, at that time, several economists and market analysts were questioning the record highs in stock markets and the extremely low levels of volatility, given the potential global turmoil that could be generated in 2017 by a variety of events and risk factors. Notably, uncertainty surrounding the new U.S. Administration’s policies and global geopolitical risks associated with a rising populism and anti-globalization sentiment were reasons for concern, which could be exacerbated by the scheduled presidential and parliamentary elections in major countries in Europe (e.g., Netherlands, France, Germany) and other parts of the world, as well as the predicted official triggering of Brexit by the United Kingdom.4 From a qualitative perspective, we deemed it prudent to adopt a “wait-and-see” approach to better assess the impact of the U.S. presidential election results and other geopolitical events in on our estimate of the forward-looking ERP. As such, on December 31, 2016, we reaffirmed the Duff & Phelps U.S. ERP recommendation of 5.5%.5 We are now revisiting our recommendation based on recent trends in economic indicators and financial market conditions.
A Two-Dimensional Process
There is no single universally accepted methodology for estimating the ERP; consequently, there is wide diversity in practice among academics and financial advisors regarding ERP estimates. For this reason, Duff & Phelps employs a two-dimensional process that considers a broad range of economic information and multiple ERP estimation methodologies to arrive at its recommendation. First, a reasonable range of normal or unconditional ERP is established. Second, based on current economic conditions, we estimate where in the range the true ERP likely lies (top, bottom, or middle). Long-term research indicates that the ERP is cyclical.6 We use the term normal, or unconditional ERP to mean the long-term average ERP without regard to current market conditions. This concept differs from the conditional ERP, which reflects current economic conditions.7 The “unconditional” ERP range versus a “conditional” ERP is further distinguished as follows:
“What is the range?”
- Unconditional ERP Range-The objective is to establish a reasonable range for a normal or unconditional ERP that can be expected over an entire business cycle. Based on an analysis of academic and financial literature and various empirical studies, we have concluded that a reasonable long-term estimate of the normal or unconditional ERP for the U.S. is in the range of 3.5% to 6.0%.8
“Where are we in the range?”
- Conditional ERP-The objective is to determine where within the unconditional ERP range the conditional ERP should be, based on current economic conditions. Research has shown that ERP fluctuates during the business cycle. When the economy is near (or in) a recession, the conditional ERP is at the higher end of the normal, or unconditional ERP range. As the economy improves, the conditional ERP moves back toward the middle of the range and at the peak of an economic expansion, the conditional ERP approaches the lower end of the range.
Conditional Equity Risk Premium
In estimating the conditional ERP, valuation analysts cannot simply use the long-term historical ERP without further analysis. There is ample academic evidence that equity risk premia are not constant over time. Professor John Cochrane (senior fellow at the Hoover Institution at Stanford University) has summarized the changes in our knowledge of estimating rates of return for equity over the last 40 years, while emphasizing the need to adjust our valuation procedures and methodologies accordingly:9 “Discount rates vary a lot more than we thought. Most of the puzzles and anomalies that we face amount to discount-rate variation we do not understand. Our theoretical controversies are about how discount rates are formed. We need to recognize and incorporate discount-rate variation in applied procedures.” Duff & Phelps goes beyond historical measures of ERP by examining approaches that are sensitive to the current economic and financial market conditions. In Exhibit 1, we list the primary factors considered when arriving at the Duff & Phelps recommended U.S. ERP: we document the evolution of these factors from January 31, 2016-the last time we changed our recommendation – through July 31, 2017, along with the corresponding relative impact on ERP indications.10
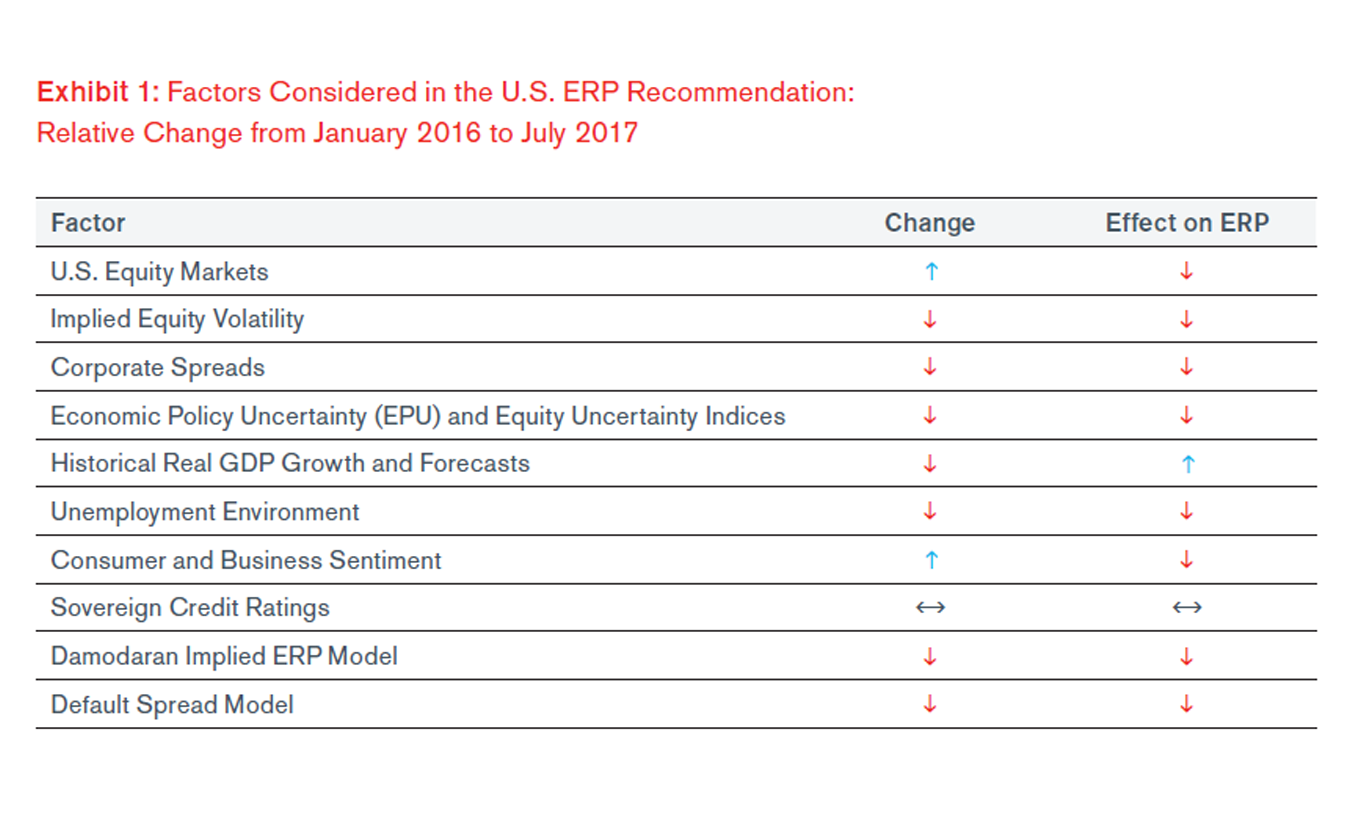
A high-level review of the same factors in August 2017 does not change materially the picture depicted above, other than an improvement in U.S. real gross domestic product (“GDP”) growth (with a significant upward revision in second quarter’s real growth), corroborating the view that system-wide risks have declined since January 2016.
Current Economic Conditions
Macroeconomic conditions provide the foundation for financial market performance, with economic growth influencing the level of interest rates, inflation, corporate earnings, and other factors that impact financial asset returns.
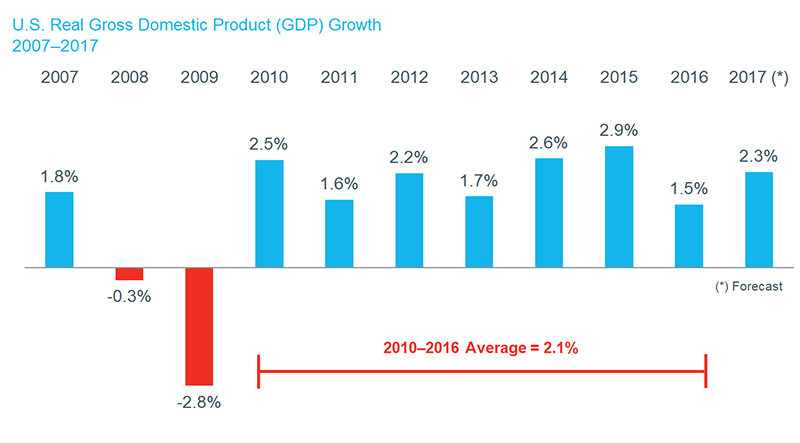
More than eight years have elapsed since the U.S. economy began its recovery from the global financial crisis of 2008 (the “Financial Crisis”). The 2008–2009 U.S. recession was declared officially over in June 2009, and was of greater duration than those of 1973–1975 and 1981–1982. The current business cycle expansion is now the third longest in U.S. history.11 However, the recent recovery has fallen short of the rebound observed in other post-World War II recessions. Real GDP growth in the year following the recessions of 1957–1958, 1973–1975, and 1981–1982 was on average 5.6%.12 In contrast, real GDP expanded by 2.5% during 2010 and by an average of 2.1% over the 2010 2016 period (see Exhibit 2).
For the last several years, the U.S. and the broader global economy have been oscillating between periods of strong and accelerating growth and periods when growth is either stagnating or weakening to positive but lackluster pace. At the beginning of 2016, less than two years ago, the world economy faced faltering growth and financial market turbulence. Fast forward to mid-2017, and the picture that emerges is very different: the world economy is finally experiencing some growth momentum, with real GDP accelerating in U.S., Europe (except for the U.K.), Japan, and China.
After a disappointing first quarter, the U.S. economy expanded in the second quarter of 2017 at its most robust pace since early 2015, supported by solid consumer spending and a pickup in business investment.13 Consumer confidence and business sentiment have improved markedly, with the former well above its long-term average.14 The employment situation has also improved, with the unemployment rate gradually declining since the beginning of 2016 and the U.S. economy moving close to full employment.
However, the U.S. labor force participation is hovering around its lowest level since the late 1970s and wages do not appear to be rising materially, especially given that the unemployment rate is near a 16-year low. Furthermore, the initial upward pressure on inflation observed in the latter half of 2016 due to rising oil prices (from a 12-year low reached back in January 2016) seems to have subsided: consumer price inflation measures remain stubbornly below the U.S. central bank’s (the Federal Reserve, or the “Fed”) target of 2.0%.15 Finally, it is noted that in the near-term, U.S. economic indicators may temporarily reflect the negative impact of Hurricanes Harvey and Irma, which caused severe damage in Texas and Florida, respectively.
Thus far, the global economic recovery has been supported by unprecedented monetary policies introduced after the Financial Crisis began. Since the onset of the crisis, the Fed and other major central banks–including the European Central Bank (“ECB”), the Bank of England (“BOE”), and the Bank of Japan (“BOJ”)–have (i) lowered their benchmark interest rates near or below 0.0% (zero); and (ii) implemented several rounds of unconventional quantitative easing (“QE”) measures.
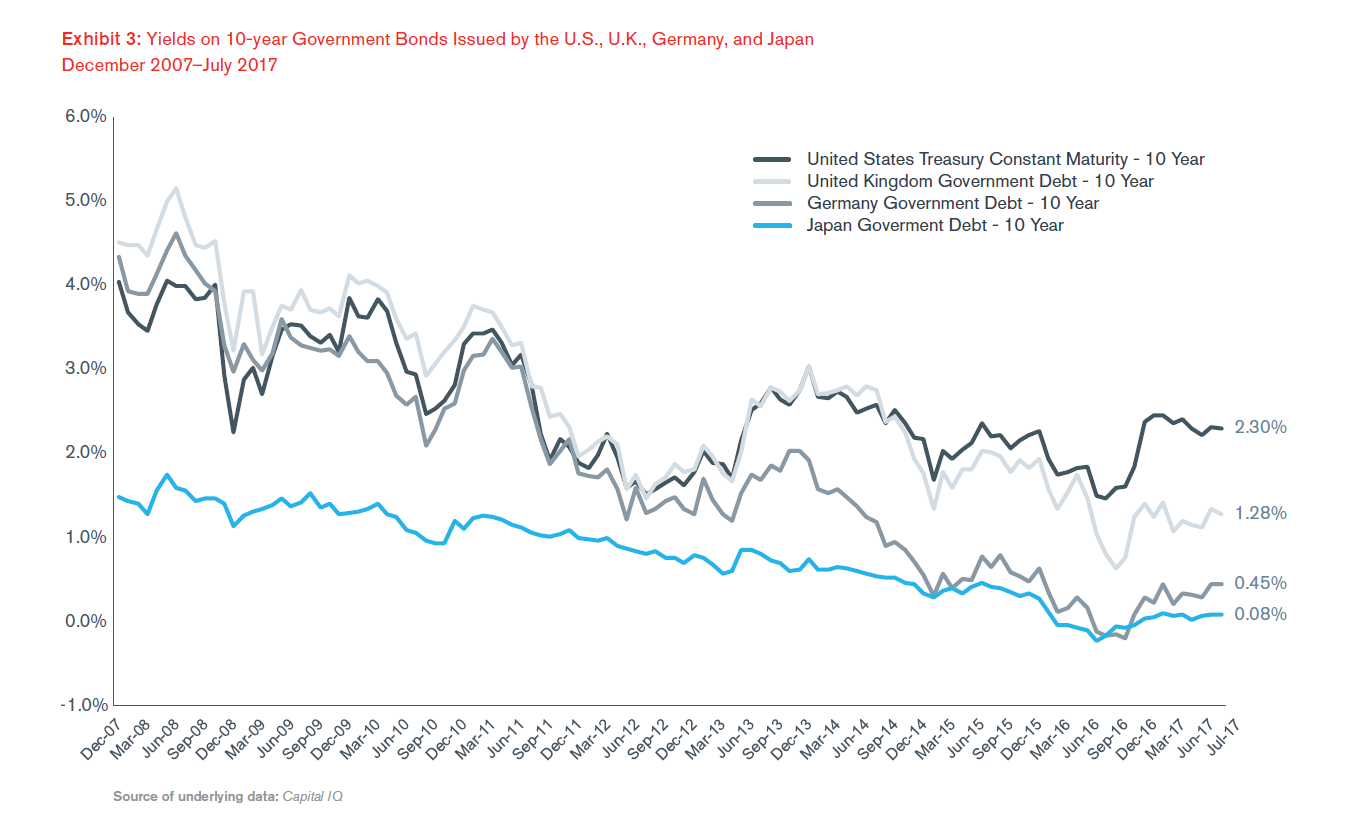
The resulting sizable increases in these central banks’ balance sheets (largely due to holdings of long-term governments securities considered “safe” by investors), along with various flight-toquality episodes, have continued to exert a downward pressure on global long-term interest rates (see Exhibit 3).16
In a recently-released academic study (June 2017), the authors showed empirical evidence suggesting that the composition of the Fed’s balance sheet can significantly affect prices of U.S. Treasury securities (and therefore their yields), as well as the term structure of interest rates; this is contrary to most theoretical literature, which would suggest that the ability of the Fed to have an impact on long term interest rates is limited. In a separate academic study, released in April 2017, the authors estimated that (at that time) the cumulative effect of the Fed’s QE programs resulted in a reduction in the 10-year U.S. Treasury yield term premium of about 100 basis points (“b.p.”). For practical purposes, this is what this estimate would translate into: in absence of QE actions by the Fed, the 10-year yield of 2.3% as of July 31, 2017 (see Exhibit 3) would likely have been around 3.3% instead.18
The Fed kept a zero-interest-rate policy (dubbed “ZIRP” in the financial press) for seven years, from December 2008 until December 2015. After a 10-year period with only one interest rate hike (in December 2015), the Fed finally embarked on a path of monetary policy normalization: the Fed raised the target range for its benchmark rate (the Federal Funds Rate) three times in six months, a 25 b.p. rise at each of its December 2016, March 2017, and June 2017 meetings. Another 25 b.p. rate rise is expected at the Fed’s December meeting, with further hikes projected for 2018.19 In addition, in the June 2017 meeting, the Fed revealed some details on its strategy to reduce its $4.5 trillion balance sheet, corroborated at its July meeting–this slow and lengthy unwinding process is slotted to begin in October 2017.20 The Fed has cited improvements in economic activity, labor market conditions, and a gradual increase in inflation measures towards its target, as support for the rate increases and QE unwinding (or “QExit”, as labeled in some of the financial press).
Nevertheless, the current range of 1.00% to 1.25% for the Fed’s benchmark rate is well below historical levels, and is still providing a significant stimulus to the economy. Likewise, the outlined plan for QE unwinding means that only a small fraction of the Fed’s large asset holdings will be coming off its balance sheet at a time, thereby contributing to only gradual increases in interest rates. As a starting point, the Fed plans to let an approximately combined $10 billion in U.S. Treasuries, agency debt, and agency mortgage-backed securities expire on a monthly basis. Over time, these amounts will gradually increase to levels up to $50 billion per month. The Fed will continue its policy of reinvesting the principal of its other maturing assets.21
For perspective, even a $50 billion monthly amount of expiring securities represents just slightly-above 1% of the Fed’s current balance sheet (or $600 billion, around 13%, on an annual basis). This may partially help explain why U.S. government bond yields continue to be so low, despite the latest decisions by the Fed regarding monetary policy tightening. Other drivers may also include the expectation that loose monetary policies by other major central banks (e.g., ECB, BOJ) will continue in the foreseeable future, the belief that real rates could be permanently lower, and the perception that a U.S. political gridlock may thwart attempts to kickstart real economic growth to a 3.0% level–the historical long-term average prior to the Financial Crisis.22 In other words, investors seem to be pricing a “lower for longer” scenario. The concept that investors may be pricing lower real (neutral) rates has been reiterated by Fed Chair Janet Yellen in the press conference following the Fed’s September meeting: 23,24
“Market participants may have lower estimates or believe that a low neutral rate may be more persistent.”
Of course, this monetary policy path could be altered by President Trump’s selection of a newFed Chair. Dr. Yellen’s current term is set to expire in February 2018. Failure to renew her term for another four years could have significant repercussions, not just for the interest rate policy in the United States, but also wider side effects to the global economy.
In Exhibit 4, we show how the 20-year U.S. Treasury yield–a typical proxy for the risk-free rate in U.S. dollars–has evolved from December 2007 through July 2017; in particular, notice the initial uptick in yields immediately after the November Presidential election, then a slight decrease followed by a standstill ever since.
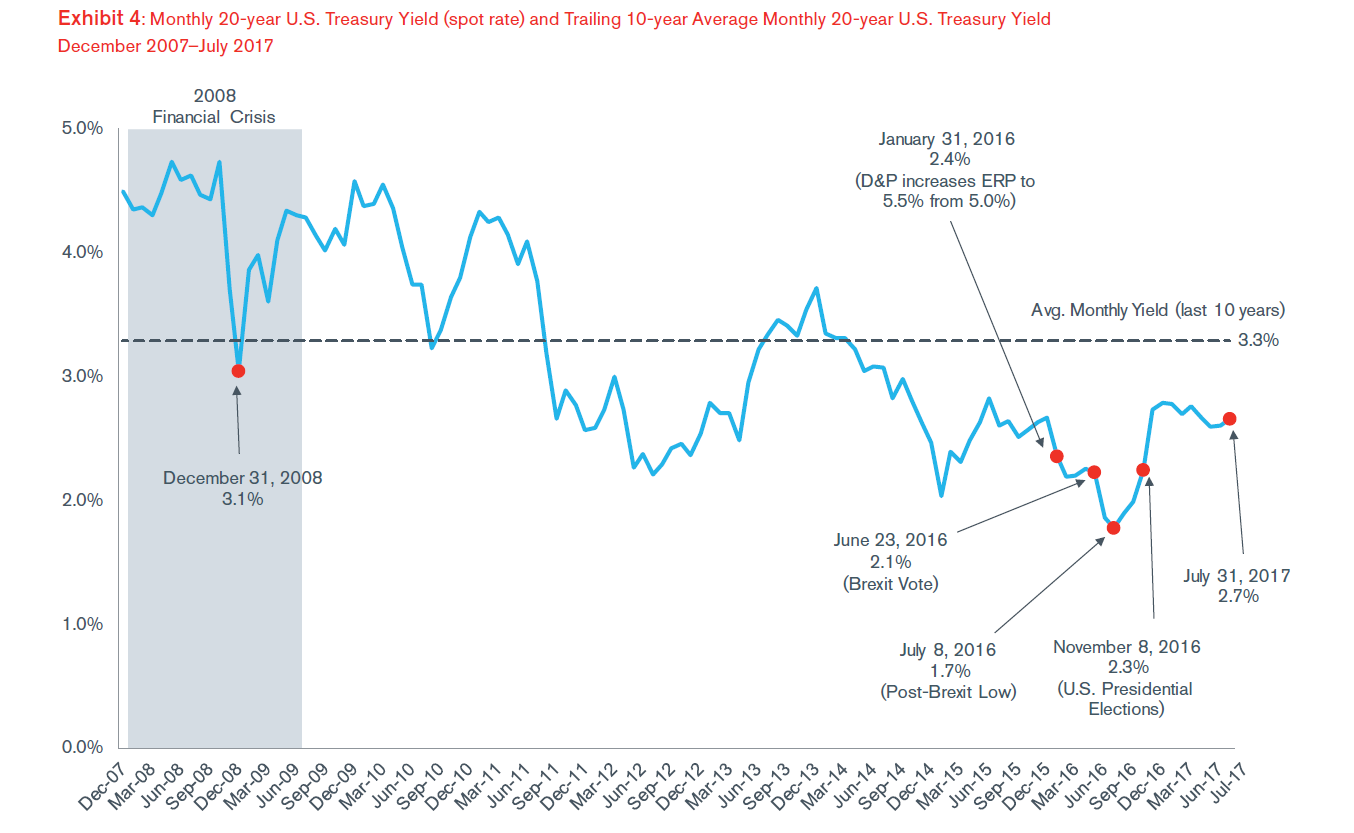
Looking at more recent data, the 20-year yield was 2.5% at the end of August and 2.4% on September 5, 2017, the effective date for the new Duff & Phelps U.S. ERP recommendation. Both are still below the 10-year trailing average of 3.3% for the 20 year U.S. Treasury yield.
In summary, while current economic indicators are generally strong, there are still significant risks in the medium term. The International Monetary Fund (“IMF”) has recently emphasized the current positive global economic conditions in its semi-annual “World Economic Outlook”, but added a word of caution on the incompleteness of the recovery from the Financial Crisis and the possible sense of complacency by policymakers and financial markets:25
“The global cyclical upswing that began midway through 2016 continues to gather strength. Only a year and a half ago, the world economy faced stalling growth and financial market turbulence. The picture now is very different, with accelerating growth in Europe, Japan, China, and the United States. Financial conditions remain buoyant across the world, and financial markets seem to be expecting little turbulence going forward, even as the Federal Reserve continues its monetary normalization process and the European Central Bank inches up to its own.
These positive developments give good cause for greater confidence, but neither policymakers nor markets should be lulled into complacency. A closer look suggests that the global recovery may not be sustainable—not all countries are participating, inflation often remains below target with weak wage growth, and the medium-term outlook still disappoints in many parts of the world. The recovery is also vulnerable to serious risks. Financial markets that ignore these risks are susceptible to disruptive repricing, and are sending a misleading message to policymakers.”
Current Financial Market Conditions
The last time Duff & Phelps changed its U.S. ERP recommendation was on January 31, 2016 (from 5.0% to 5.5%). Since then, aggregate risks in U.S. markets appear to have declined.
U.S. Equity Markets
Looking back, 2016 turned out to be a year full of surprises and extreme events. Early 2016 saw financial markets in turmoil, with sharp declines in equity prices, further widening of credit spreads, and a general tightening of financial conditions. Although some financial markets rebounded from the beginning-of-the-year jitters, uncertainty increased in late June when (contrary to analysts’ and global investors’ predictions) the U.K. electorate voted to end its membership in the European Union (known in the financial press as “Brexit”). Yields on U.S., German, and Japanese government securities fell sharply in safe-haven flows, while global equity prices declined significantly.
However, the second major surprising political event of the year–the outcome of the U.S. presidential election in November 2016 – marked a change in investor sentiment, accompanied initially by a rise in global interest rates, a sharp narrowing of credit spreads, a strengthening of the U.S. dollar, and a rally in equity markets to record highs.
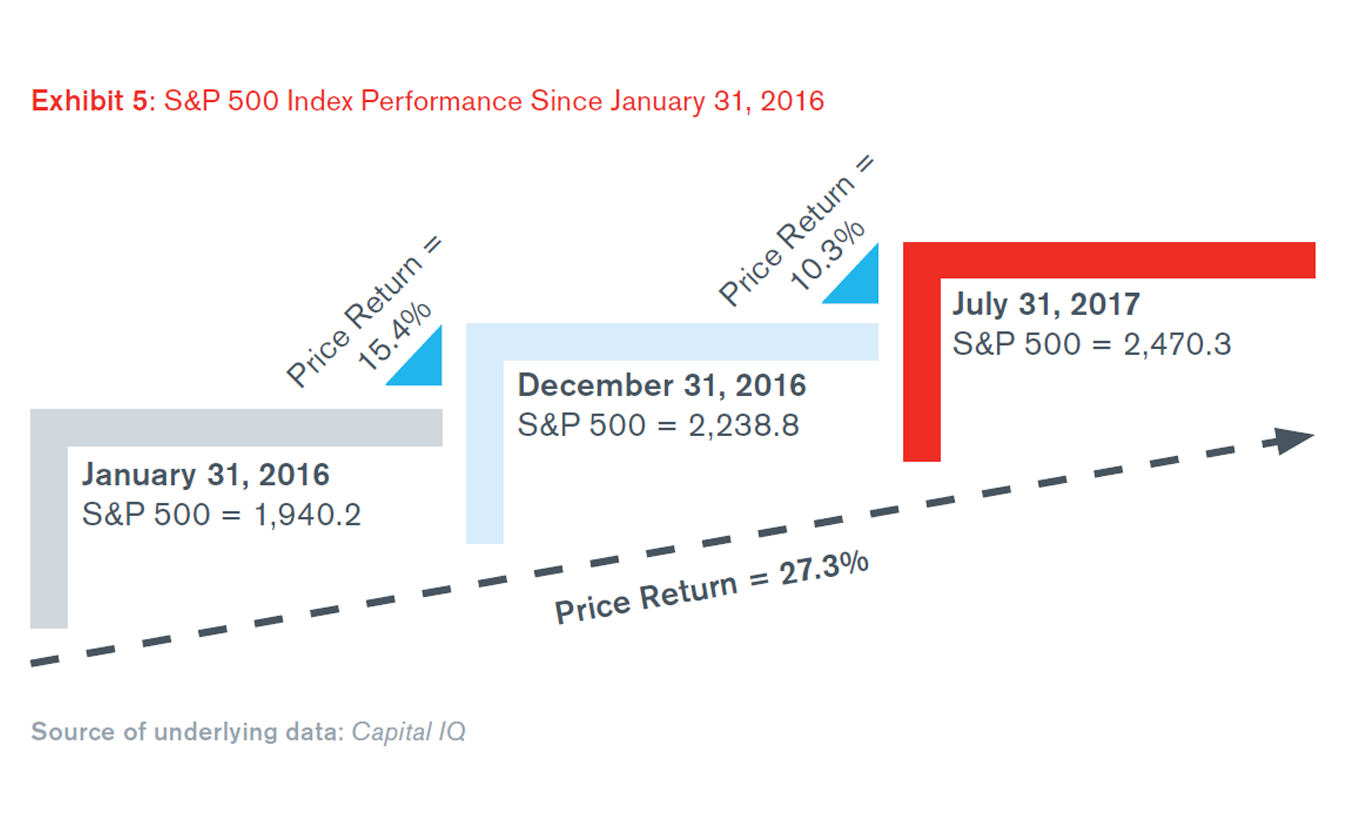
While the so-called “reflation trade” abated at times during the first half 2017 (with government bond yields reversing some of the earlier gains), stock markets have continued their ascent. For perspective, as of July 31, 2017, the S&P 500 Index has increased 10.3% since year-end 2016 and is up 27.3% since January 2016 (see Exhibit 5). The S&P 500 closed at record highs in June and July 2017.
Since then, new records have been reached across U.S. equity markets in August, September, and through early October 2017.
Progress on the U.S. legislative front has been disappointing and expectations for a big fiscal stimulus package to be passed during 2017 have diminished. Yet, strong earnings growth, still-accommodative monetary policies, and benign global macroeconomic trends have buoyed U.S. stocks. Corporate earnings have surpassed expectations, fueling hopes for even higher dividend payouts and stock buybacks. More recently, the announcement of a high-level plan for U.S. corporate tax reform, including a corporate statutory tax rate cut from 35% to 20%, has spurred further stock market records.
Some analysts have characterized the current environment as a “goldilocks” children’s tale of “not-too-hot and not too-cold”: modest growth, subdued inflation, low unemployment, and low interest rates, accompanied by high valuations and low implied volatility. In July 2017, Mohamed El-Erian, Chief Economic Advisor at Allianz, and a well-known market analyst, described the state of financial markets as follows26:
“Over the past few months, government bond yields have fallen, the dollar has weakened and financials have underperformed, yet the major stock indexes are at or very near record highs, as persistently supportive liquidity conditions have more than compensated for policy and growth disappointments. By boosting returns and repressing volatility, ample liquidity is a gift for investors. It makes the investment journey pleasing, comfortable and lengthy. But it is not a destination. (…) The markets’ overall sense of ‘goldilocks’ -- not too hot, not too cold -- explains much of the gap between buoyant stock indexes and lagging economic and policy fundamentals.”
In a later article, he justified the current levels in stock markets as follows27:
“With plentiful liquidity having conditioned investors to ‘buy on dips’, it would take a major shock to dislodge investors from behaviour that, repeatedly, has proven highly remunerative, despite unusually fluid geopolitical, institutional and political conditions.”
For the time being, there appears to be some justification for the positive investor sentiment particularly given the benign macroeconomic conditions and the support provided by major central banks’ monetary policies. However, it remains to be seen what the impact will be to financial markets, when major central banks begin their monetary policy normalization and some of their support is removed.
Implied Equity Volatility
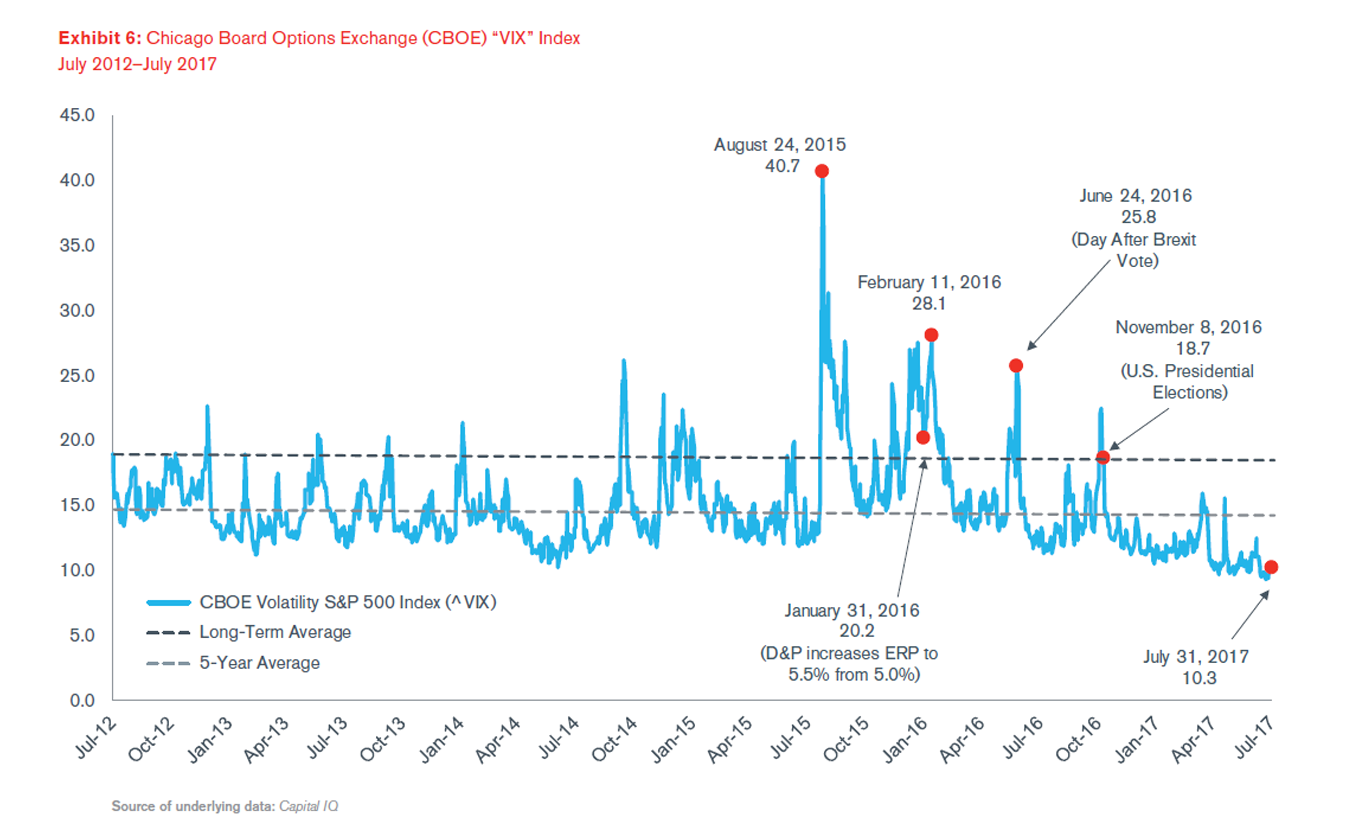
Implied equity volatility, as measured by the Chicago Board Options Exchange (CBOE) “VIX” Index, has been termed a “fear index” as it can be a gauge of investor apprehension. Volatility in U.S. equity markets has declined sharply since January 2016 (see Exhibit 6).
Investors appear remarkably upbeat, despite high valuations across many asset classes and considerable U.S. political uncertainty and elevated geopolitical tensions. Since the U.S. Presidential elections, the VIX Index has gradually decreased and it has now declined to levels well below the long-term average (see Exhibit 6).
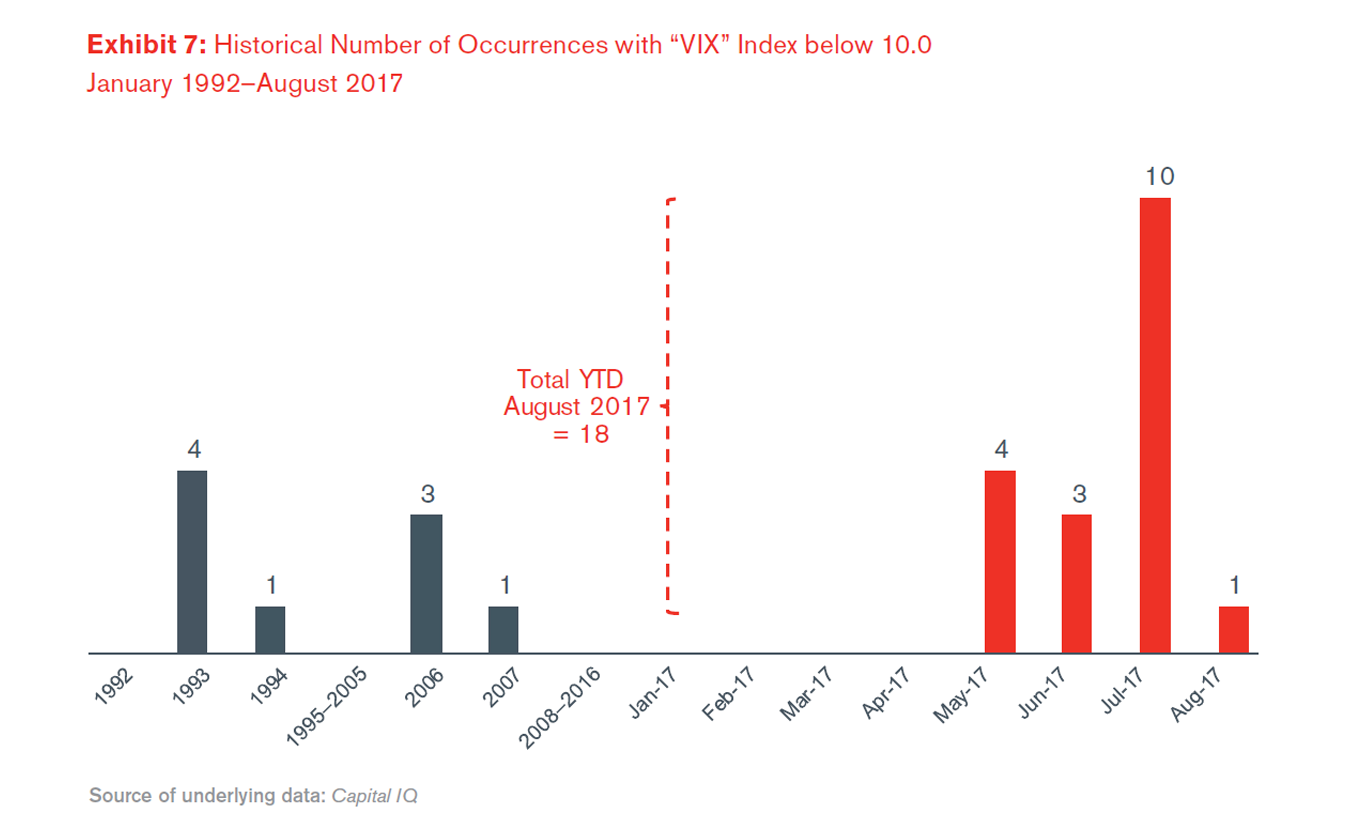
In fact, since May 2017, the VIX Index has dipped several times below a level of 10.0, a rare occurrence prior to 2017. As shown in Exhibit 7, before 2017, there were only nine (9) times in the VIX history when the index was below 10.0. In contrast, since the beginning of the year until the end of August 2017, the VIX was below 10.0 in 18 separate occasions.
More recent data reveals that this trend has continued in September and early October. Remarkably, on October 5, 2017, the VIX recorded its lowest level in history of 9.19. The previous low-level record of 9.3 was reached in December 1993.
It is true that various events that were forecasted in early 2017 to be potential sources of global geo political risks were not as disruptive as anticipated. For instance, anti- establishment, anti-European Union candidates in major European elections have not gained power, as once feared. The Dutch parliamentary elections in March did not yield power to the nationalist populist candidate. Likewise, the French presidential elections in April and May ended in the decisive defeat of the far-right nationalist candidate and her party, offering significant relief to the future of the European Union. In June, the attempt to gain a clear mandate for Brexit negotiations by Prime Minister Theresa May ended with a failure to maintain her Conservative Party’s majority in Parliament. While increasing political uncertainty for the United Kingdom, this made the possibility of a “Soft Brexit” more plausible.
More recently, however, tensions between the United States and North Korea have increased the threat of nuclear confrontation between the two countries. Elsewhere, the German farright party has gained substantially more votes in parliamentary elections than anticipated, leading to a more fragmented government coalition led by Chancellor Angela Merkel, which may create new sources of instability in 2018.
Notwithstanding the current investor perception of negligible levels of risk, sentiment could quickly reverse if the U.S. Administration fails to implement its pro-growth policies, interest rates rise too quickly, global growth stalls, or one of the various sources of geopolitical risk comes to the forefront. Various economists and analysts have warned of excessive complacency in financial markets. Central bankers have also started to take notice. A recent article summarizes how their views on this matter may be interpreted28:
“Central banks have taken note. The concerted policy message in the past couple of months has been to caution about complacency in global market valuations, as reflected in unusually low risk premia across assets and geographies. (…) In a nutshell, central banks are not necessarily turning more hawkish, in defiance of their inflation stability mandates. Rather they are clearly signalling that investors are becoming far too complacent about the policy outlook-and that risks financial stability.”
Corporate Credit Spreads
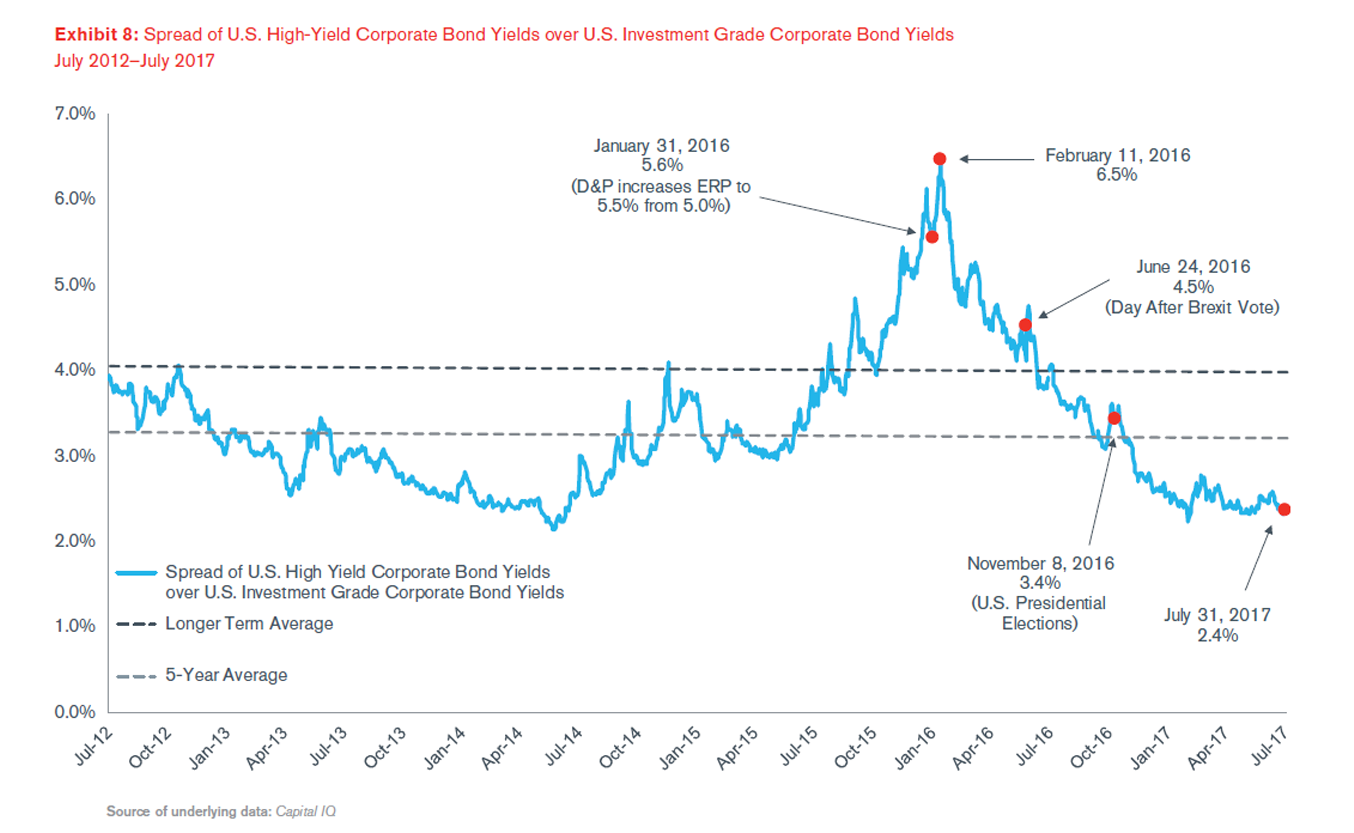
Since February 2016, corporate credit spreads have tightened materially. As mentioned earlier, the outcome of the U.S. presidential elections in November marked a change in investor sentiment, which was accompanied initially by a rise in global interest rates and a sharp narrowing of credit spreads. Since early 2017, U.S. Treasury yields have plateaued, as an initial rise in inflation reversed course and hopes for an imminent U.S. fiscal expansion diminished. Corporate spreads, however, reached their lowest levels since mid-2014 (see Exhibit 8).
Since the onset of the 2008 Financial Crisis, fixed income markets have been significant beneficiaries of the QE policies implemented by major central banks across the globe. Large asset purchases by central banks have created an environment of ultra-low interest rates, encouraging new corporate debt issuance on a global basis. In addition, QE programs in the Eurozone, United Kingdom, and Japan include investment-grade corporate debt securities, thereby decreasing borrowing costs for those corporations even further.
Ratings agencies have started warning of the potential challenges that may ensue when central banks start normalizing their interest rate policies and unwinding their balance sheets. The most immediate danger comes from the United States, where the Fed has now embarked on its path to normalization. A recent report from Fitch Ratings cautions that despite a current positive environment, the unwinding of QE will create challenges to both lenders (investors) and borrowers (corporations)29:
“(…) the improving outlook for global credit quality is underpinned by years of loose central bank monetary policy, including quantitative easing (QE), as well as what are now the strongest world growth conditions since 2010. ‘Looking ahead in the rating cycle, the most benign credit market conditions in modern history will gradually begin to normalise as central bank assistance is withdrawn and world growth peaks in 2018. This could begin to temper the otherwise upbeat rating outlook trend’ (…) Unwinding QE will pose challenges to both borrowers and lenders.”
Additional Indicators Supporting the ERP Change – Quantitative Models
In addition to the general economic factors and financial market conditions described above, Duff & Phelps monitors other indicators that may provide a more quantitative view of where we are within the range of reasonable long-term estimates for the U.S. ERP.
Duff & Phelps currently uses several models as corroborating evidence. We reviewed the following indicators at the end of July and August 2017:
- Damodaran Implied ERP Model – New York University Professor Aswath Damodaran calculates implied ERP estimates for the S&P 500 and publishes his estimates on his website. Prof. Damodaran estimates an implied ERP by first solving for the discount rate that equates the current S&P 500 index level with his estimates of cash distributions (dividends and stock buybacks) in future years. He then subtracts the current yield on 10-year U.S. government bonds to arrive at an implied ERP. Prof. Damodaran allows the user to select a variety of methods to project cash flow yields, as well as several expected growth rate choices for the terminal year in the valuation. Duff & Phelps converts Prof. Damodaran’s implied ERP estimates to an arithmetic average equivalent measured against the 20-year U.S. government bond yield, relying primarily on two measures of projected cash flows: (i) the trailing 12-month cash flow yield (dividends plus buybacks) of S&P 500 constituents; and (ii) the trailing 10-year average cash flow yield (dividends plus buybacks) of S&P 500 constituents.30
Based on Prof. Damodaran’s estimates of the trailing 12-month cash flow yield, the implied ERP (converted into an arithmetic average equivalent) was approximately 6.07% at end of July 2017, when measured against an abnormally low 20-year U.S. government bond yield (2.66%).31 The equivalent normalized implied ERP estimate was 5.23% measured against a normalized 20-year U.S. government bond yield of 3.5%. At the end of August 2017, the implied ERP (converted into an arithmetic average equivalent) was approximately 6.09%, when measured against the spot 20-year U.S. government bond yield (2.47%).32 The equivalent normalized implied ERP estimate was 5.06% measured against a 3.5% normalized 20-year risk-free rate. These July and August normalized implied ERP estimates represent a decline of 62 b.p. and 79 b.p. respectively, relative to the January 2016 estimate (5.85%).
- Default Spread Model (DSM) – The Default Spread Model is based on the premise that the long-term average ERP (the unconditional ERP) is constant and deviations from that average over an economic cycle can be measured by reference to deviations from the long-term average of the default spread between corporate bonds rated in the Baa category by Moody’s versus those in the Aaa rating category. This model notably removes the risk-free rate itself as an input in the estimation of ERP.33 However, the ERP indication resulting from the DSM is still interpreted as an estimate of the relative return of stocks in excess of risk-free securities.
At the end of July and August 2017, the conditional ERP calculated using the DSM model was 4.86% and 4.90%, respectively. These indications represent declines of 79 b.p. and 75 b.p. respectively, relative to the 5.65% ERP indication at the end of January 2016.
- Hassett Implied ERP (Hassett) – Stephen Hassett has developed a model for estimating the implied ERP, as well as the estimated S&P 500 index level, based on the current yield on long-term U.S. government bonds and a risk premium factor (“RPF”).34 The RPF is the empirically derived relationship between the risk-free rate, S&P 500 earnings, real interest rates, and real GDP growth to the S&P 500 index over time. The RPF appears to change only infrequently. The model can be used monthly to estimate the S&P 500 and the conditional ERP based on the current level of interest rates.35
Hassett’s analysis uses the spot 10-year risk-free rate for the period from January 2008 through July 2011; thereafter, his analysis uses a normalized yield on U.S. Treasuries of 4.0% (2.0% real risk-free rate plus 2.0% inflation) and 4.5% (2.0% real risk-free rate plus 2.5% inflation).36 Using a normalized 4.0% risk-free rate at the end of July and August 2017, the S&P 500 index appeared to be somewhat overvalued based on the Hassett model’s predictions, whereas using a 4.5% normalized risk-free rate would imply the index is substantially overvalued. Alternatively, based on the S&P 500 index level at the end of July and August 2017, the implied risk-free rate commensurate with the index closing price was 3.58% and 3.57%, respectively. These indications for the risk-free rate are very close to the Duff & Phelps concluded normalized risk-free rate of 3.5%, effective November 15, 2016 and thereafter (reaffirmed on September 5, 2017 and until further notice).
Based on current market conditions, we find sufficient evidence for decreasing the Duff & Phelps U.S. ERP recommendation from 5.5% to 5.0%, for valuation dates as of September 5, 2017 and thereafter. We will maintain our recommendation to use a 5.0% U.S. ERP when developing discount rates until there is evidence indicating equity risk in financial markets has materially changed. We are continuing to closely monitor the aftermath of the U.S. presidential election held on November 8, 2016 and its impact on cost of capital assumptions.
The current ERP recommendation was developed in conjunction with a “normalized” 20-year yield on U.S. government bonds as a proxy for the risk-free rate. Based on recent academic literature and market evidence of a secular decrease in real interest rates (a.k.a. the “rental” rate) and lower long-term real GDP growth estimates for the U.S. economy, we are reaffirming our concluded normalized risk-free rate of 3.5%, established as of November 15, 2016.37
The combination of the new U.S. recommended ERP (5.0%) and the reaffirmed normalized risk-free rate (3.5%) results in an implied U.S. “base” cost of equity capital estimate of 8.5% (5.0% + 3.5%).
Adjusting the risk-free rate in conjunction with the ERP is only one of the alternatives available when estimating the cost of equity capital. Were we to use the spot yield-to-maturity of 2.4% on 20-year U.S. Treasuries as of September 5, 2017, one would have to increase the ERP assumption accordingly. One can determine the ERP against the spot 20-year yield as of September 5, 2017, inferred by Duff & Phelps recommended U.S. ERP (used in conjunction with the normalized risk-free rate), by using the following formula:
U.S. ERP Against Spot 20-year Yield (Inferred) = D&P Recommended U.S. ERP + Normalized Risk-Rate Free Rate - Spot-20 year US Treasury Yield = 5.0% +3.5% - 2.4% = 6.1%
1. For a discussion of some of the studies and factors we evaluate, refer to Chapter 3 of the Duff & Phelps.
2. Refer to the Duff & Phelps Client Alert issued on March 16, 2016, which was titled “Duff & Phelps Increases U.S. Equity Risk Premium Recommendation to 5.5%, Effective January 31, 2016”. To obtain a free copy of this Client Alert and prior ones documenting the Duff & Phelps’ U.S. ERP recommendation over time, visit: www.duffandphelps.com/CostofCapital.
3. See the Duff & Phelps Client Alert issued on January 12, 2017, which was titled “Duff & Phelps’ U.S. Normalized Risk-Free Rate Decreased from 4.0% to 3.5%, Effective November 15, 2016”, also found at: www.duffandphelps.com/CostofCapital.
4. On June 23, 2016, the U.K. electorate voted to leave the European Union, which is known in the financial press as the “Brexit” vote. For further details, refer to the Duff & Phelps Client Alert “Brexit: The Impact on Cost of Capital”, dated September 14, 2016, available at www.duffandphelps.com/CostofCapital. In March 2017, the U.K. government officially triggered the two-year negotiation period to exit the European Union.
5. For a more detailed discussion of this decision, refer to Chapter 3 of the Duff & Phelps 2017 Valuation Handbook – U.S. Guide to Cost of Capital.
6. See for example John Cochrane’s “Discount Rates. American Finance Association Presidential Address” on January 6, 2011, where he presented research findings on the cyclicality of discount rates in general. His remarks were published as Cochrane, J. H. (2011), “Presidential Address: Discount Rates,” The Journal of Finance, 66: 1047–1108, available at: http://onlinelibrary.wiley.com/doi/10.1111/j.1540-6261.2011.01671.x/full. A video of his remarks is available at: http://www.afajof.org/details/video/2870771/2011-Presidential-Address.html.
7. The “conditional” ERP is the ERP estimate published by Duff & Phelps as the “Duff & Phelps Recommended ERP”.
8. See Shannon P. Pratt and Roger J. Grabowski, Cost of Capital: Applications and Examples, Fifth Edition, Chapter 8 “Equity Risk Premium”, and accompanying Appendices 8A and 8B, for a detailed discussion of the unconditional ERP. This discussion has been updated with more recent data in Chapter 3 of the Duff & Phelps 2017 Valuation Handbook – U.S. Guide to Cost of Capital.
9. John C. Cochrane (2011), “Presidential Address: Discount Rates,” The Journal of Finance, 66: 1047–1108 http://onlinelibrary.wiley.com/doi/10.1111/j.1540-6261.2011.01671.x/full.
10. The discussion in this article was based on the review of data for periods ended on or around July 31, 2017, with selected data updated through the end of August 2017. However, general information available through the time of writing (October 12, 2017) was also considered as corroborating evidence.
11. “U.S. Business Cycle Expansions and Contractions”, National Bureau of Economic Research. Underlying data accessible here: http://www.nber.org/cycles.html.
12. Source of underlying real GDP data: the U.S. Bureau of Economic Analysis.
13. Source of underlying real GDP data: the U.S. Bureau of Economic Analysis.
14. For instance, the University of Michigan Consumer Sentiment Index registered a level of 93.4, compared to a long-term average (since 1978) of 85.6.
15. Source of underlying labor and inflation statistics: the U.S. Bureau of Labor Statistics.
16. For a more detailed discussion on the proportion of U.S. Treasury securities held by the Fed , as well as other factors that have contributed to lower global interest rates, refer to Chapter 3 of the Duff & Phelps 2017 Valuation Handbook – U.S. Guide to Cost of Capital.
17. Huther, Jeffrey, Jane Ihrig, and Elizabeth Klee (2017). “The Federal Reserve’s Portfolio and its Effect on Interest Rates,” Finance and Economics Discussion Series 2017-075. Washington: Board of Governors of the Federal Reserve System, https://doi.org/10.17016/FEDS.2017.075.
18. For a discussion on the impact of the Federal Reserve’s QE programs on the term premium (or maturity premium) and the yield on 10-year U.S. Treasury bonds, see “The Effect of the Federal Reserve’s Securities Holdings on Longer term Interest Rates”, accessible here: https://www.federalreserve.gov/econres/notes/feds-notes/effect-of-the-federal-reserves-securities-holdings-on-longer-term-interest-rates-20170420.htm.
19. Minutes of the Federal Open Market Committee of the Board of Governors of the Federal Reserve System can be found by visiting: http://www.federalreserve.gov/monetarypolicy/fomccalendars.htm.
20. For the latest composition and size of the Fed’s balance sheet, refer to the Federal Reserve Bank of Cleveland’s Credit Easing data, available at: https://www.clevelandfed.org/our-research/indicators-and-data/credit-easing.aspx.
21. “FOMC issues addendum to the Policy Normalization Principles and Plans”, June 14, 2017, available here: https://www.federalreserve.gov/newsevents/pressreleases/monetary20170614c.htm.
22. For a more detailed discussion on the trends behind the decline in real interest rates, refer to “Duff & Phelps’ U.S. Normalized Risk-Free Rate Decreased from 4.0% to 3.5%, Effective November 15, 2016”, which can found here: www.duffandphelps.com/CostofCapital.
23. “FOMC: Press Conference on September 20, 2017”. The Transcript to this press conference can be found here: https://www.federalreserve.gov/mediacenter/files/FOMCpresconf20170920.pdf.
24. The neutral real rate, also called r* (r-star), stands for the longer-run value of the neutral rate. This is what the inflation-adjusted interest rate (i.e., real rate) will be once the economy is back to full strength, i.e., consistent with the economy operating at maximum employment.
25. “World Economic Outlook, October 2017 Seeking Sustainable Growth: Short-Term Recovery, Long-Term Challenges”, International Monetary Fund. For a copy of the report, visit: https://www.imf.org/en/Publications/WEO/Issues/2017/09/19/world-economic-outlook-october-2017.
26. El-Erian, Mohamed A. “The Upside and Downside of Liquidity-Driven Markets.” Bloomberg, July 21, 2017. This article can be accessed here: https://www.bloomberg.com/view/articles/2017-07-21/the-upside-and-downside-of-liquidity-driven-markets.
27. El-Erian, Mohamed A. “Jackson Hole gathering looms for investors.” Financial Times, August 9, 2017. This article can be accessed here: https://www.ft.com/content/790d1bf0-7b4a-11e7-9108-edda0bcbc928.
28. Komileva, Lena. “You are too complacent, central bankers warn markets.” Financial Times, July 30, 2017. This article can be accessed here: https://www.ft.com/content/8908f882-739b-11e7-93ff-99f383b09ff9.
29. “Fitch: QE and World Growth Buoy Global Rating Outlooks”, September 19, 2017. A summary of the report can be accessed here: https://www.fitchratings.com/site/pr/1029367?cm_mmc=ExactTarget-_.
30. Source of underlying data: downloadable dataset entitled “Spreadsheet to compute ERP for current month”. To obtain a copy, visit: http://pages.stern.nyu.edu/~adamodar/.
31. Damodaran’s implied rate of return (based on the actual 10-year yield) on the S&P 500 = 7.33% as of August 1, 2017, minus the actual 20-year U.S. Treasury yield of 2.66% plus an adjustment to equate the geometric average ERP to its arithmetic equivalent. The result reflects conversion of the implied ERP to an arithmetic average
equivalent.
32. Damodaran’s implied rate of return (based on the actual 10-year yield) on the S&P 500 = 7.16% as of September 1, 2017, minus the actual 20-year U.S. Treasury yield of 2.47% plus an adjustment to equate the geometric average ERP to its arithmetic equivalent. The result reflects conversion of the implied ERP to an arithmetic average equivalent.
33. The Default Spread Model presented herein is based on Jagannathan, Ravi, and Wang, Zhenyu,”The Conditional CAPM and the Cross-Section of Expected Returns,” The Journal of Finance, Volume 51, Issue 1, March 1996: 3–53. See also Elton, Edwin J. and Gruber, Martin J., Agrawal, Deepak, and Mann, Christopher “Is There a Risk Premium in Corporate bonds?”, Working Paper. Duff & Phelps uses (as did Jagannathan, Ravi, and Wang) the spread of high-grade corporates (proxied by yields on Aaa rated bonds) against lesser grade corporates (proxied by yields on Baa rated bonds). Corporate bond series used in analysis herein: Bloomberg Barclays US Corp Baa Long Yld USD (Yield) and Bloomberg Barclays US Corp Aaa Long Yld USD (Yield); Source: Morningstar Direct.
34. Stephen D. Hassett, ‘‘The RPF Model for Calculating the Equity Risk Premium and Explaining the Value of the S&P with Two Variables,’’ Journal of Applied Corporate Finance, 22, 2 (Spring 2010): 118–130.
35. For a more detailed description of Hassett’s Risk Premium Factor model see Pratt and Grabowski, op.cit., Chapter 8A, “Deriving ERP Estimates”: 167–168.
36. To clarify, Stephen Hassett uses a 2.0% real rate in his analysis for a normalized yield on U.S. Treasuries. Duff & Phelps uses a range of 0.0% to 2.0% for the long-term real rate. Refer to Chapter 3 of the 2017 Valuation Handbook – U.S. Guide to Cost of Capital.
37. Refer to “Duff & Phelps’ U.S. Normalized Risk-Free Rate Decreased from 4.0% to 3.5%, Effective November 15, 2016”. For a more detailed discussion on how Duff & Phelps estimates a normalized risk-free rate, refer to Chapter 3 of the 2017 Valuation Handbook – U.S. Guide to Cost of Capital.


Stay Ahead with Kroll
Valuation Services
When companies require an objective and independent assessment of value, they look to Kroll.
Business Valuation Services
Kroll is the largest independent provider of business valuation services.
Valuation Services
When companies require an objective and independent assessment of value, they look to Kroll.
Fairness Opinions
Our Opinions practice is a global leader in Fairness Opinions and Special Committee Advisory, ranking #1 for total number of fairness opinions globally in 2025 and over the last 20 years according to LSEG (fka Refinitiv).